3 Supplementary results
3.1 Histograms for each group per metric
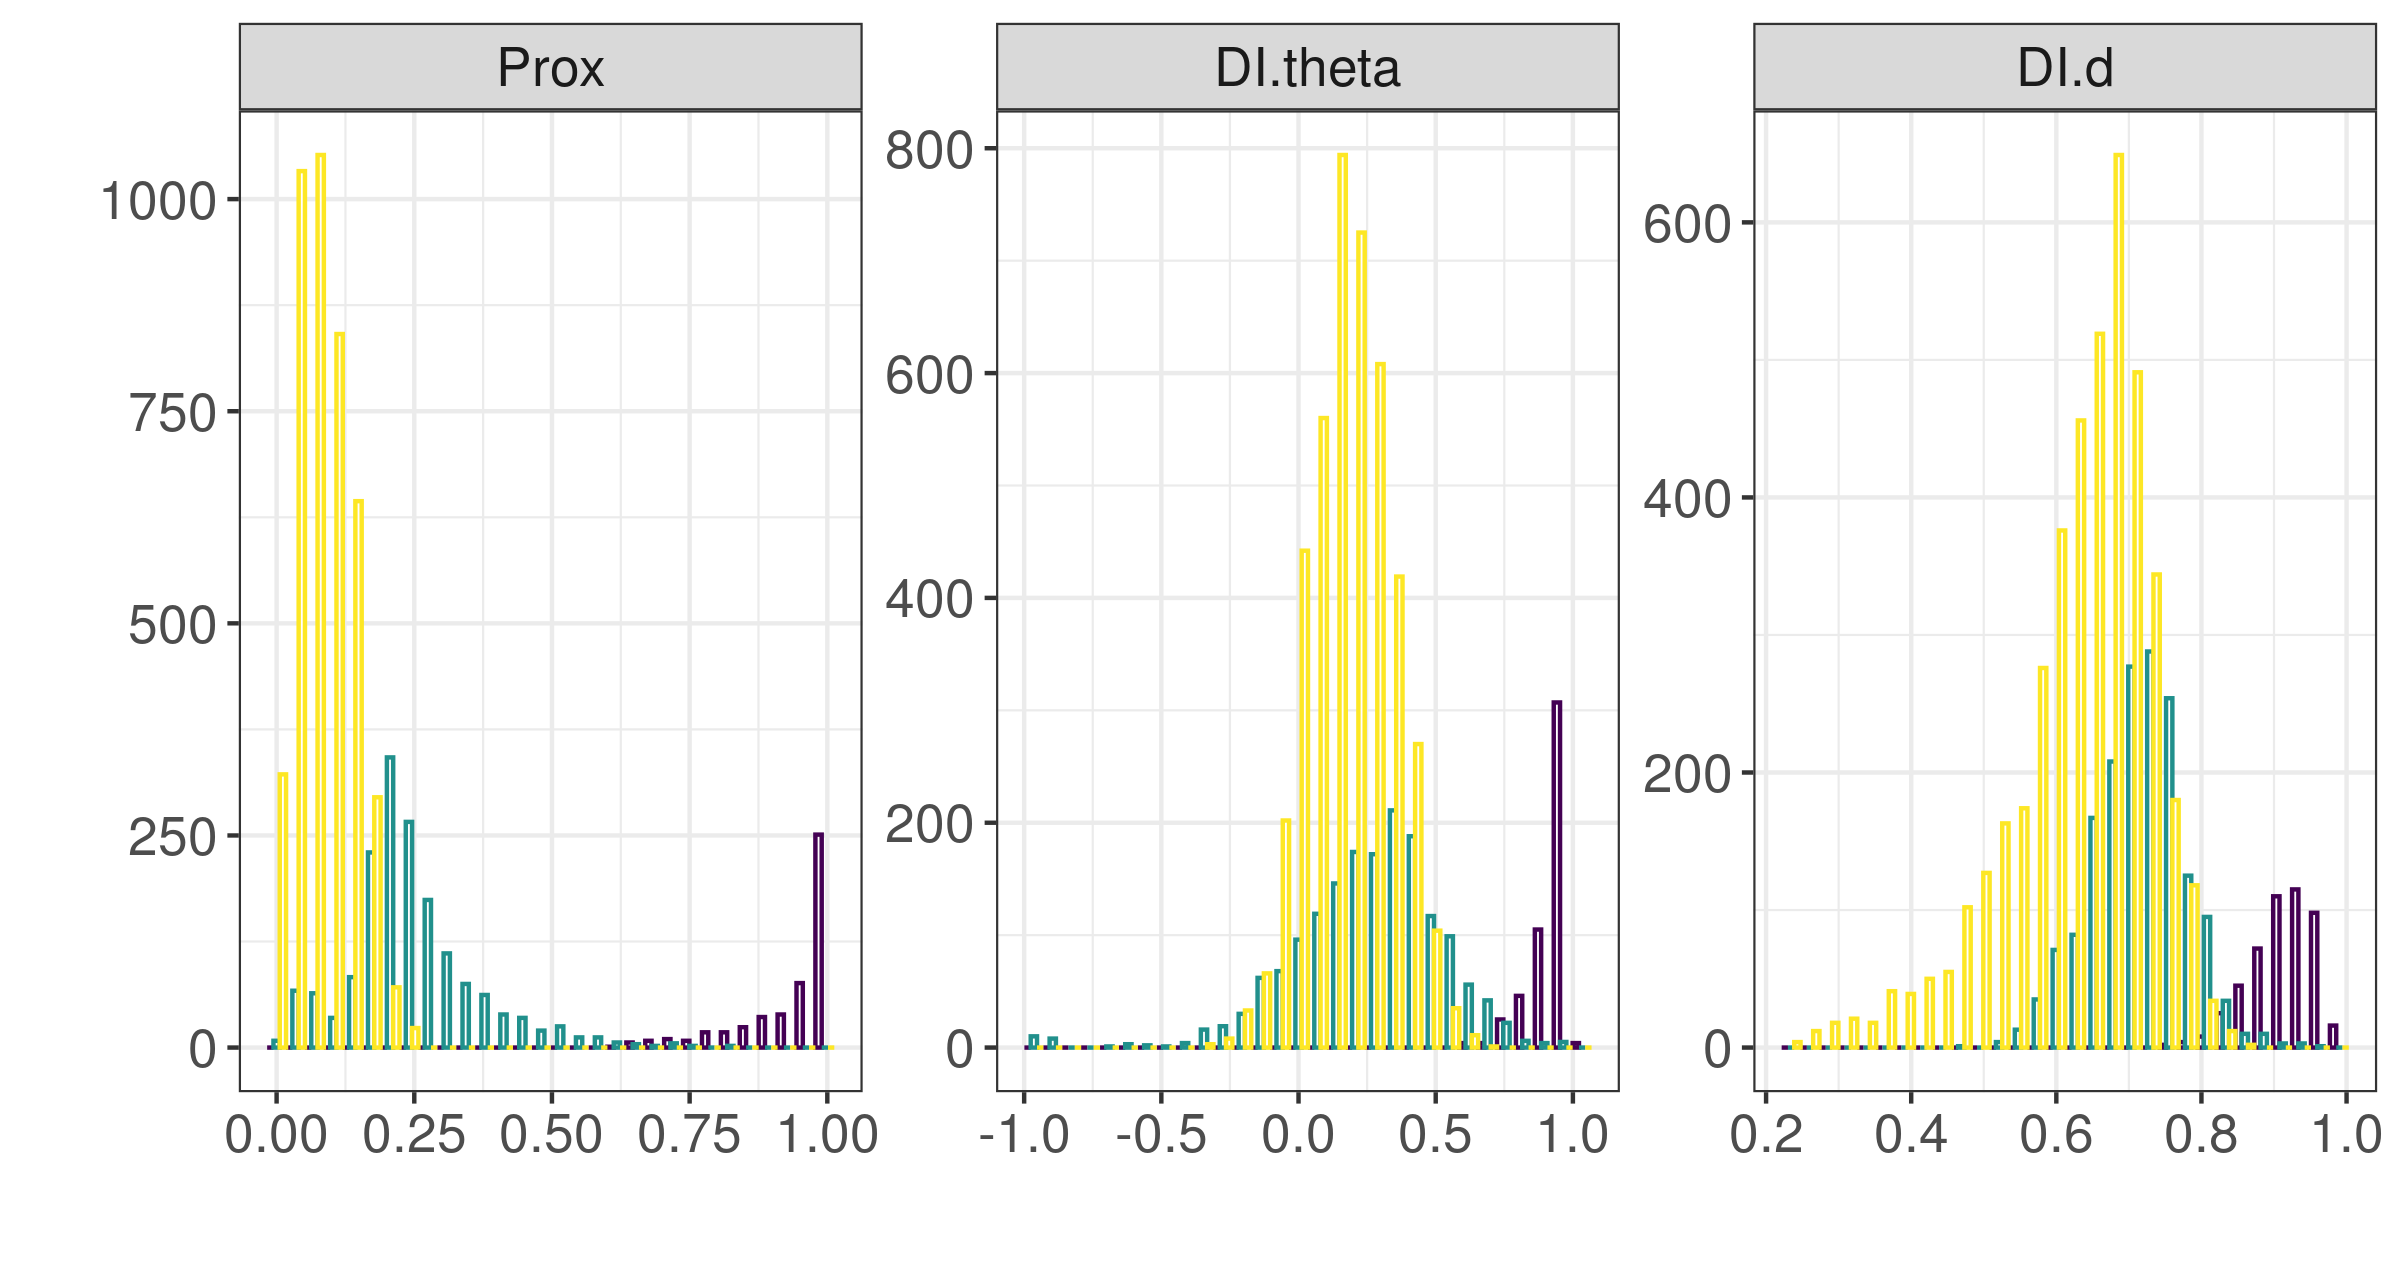
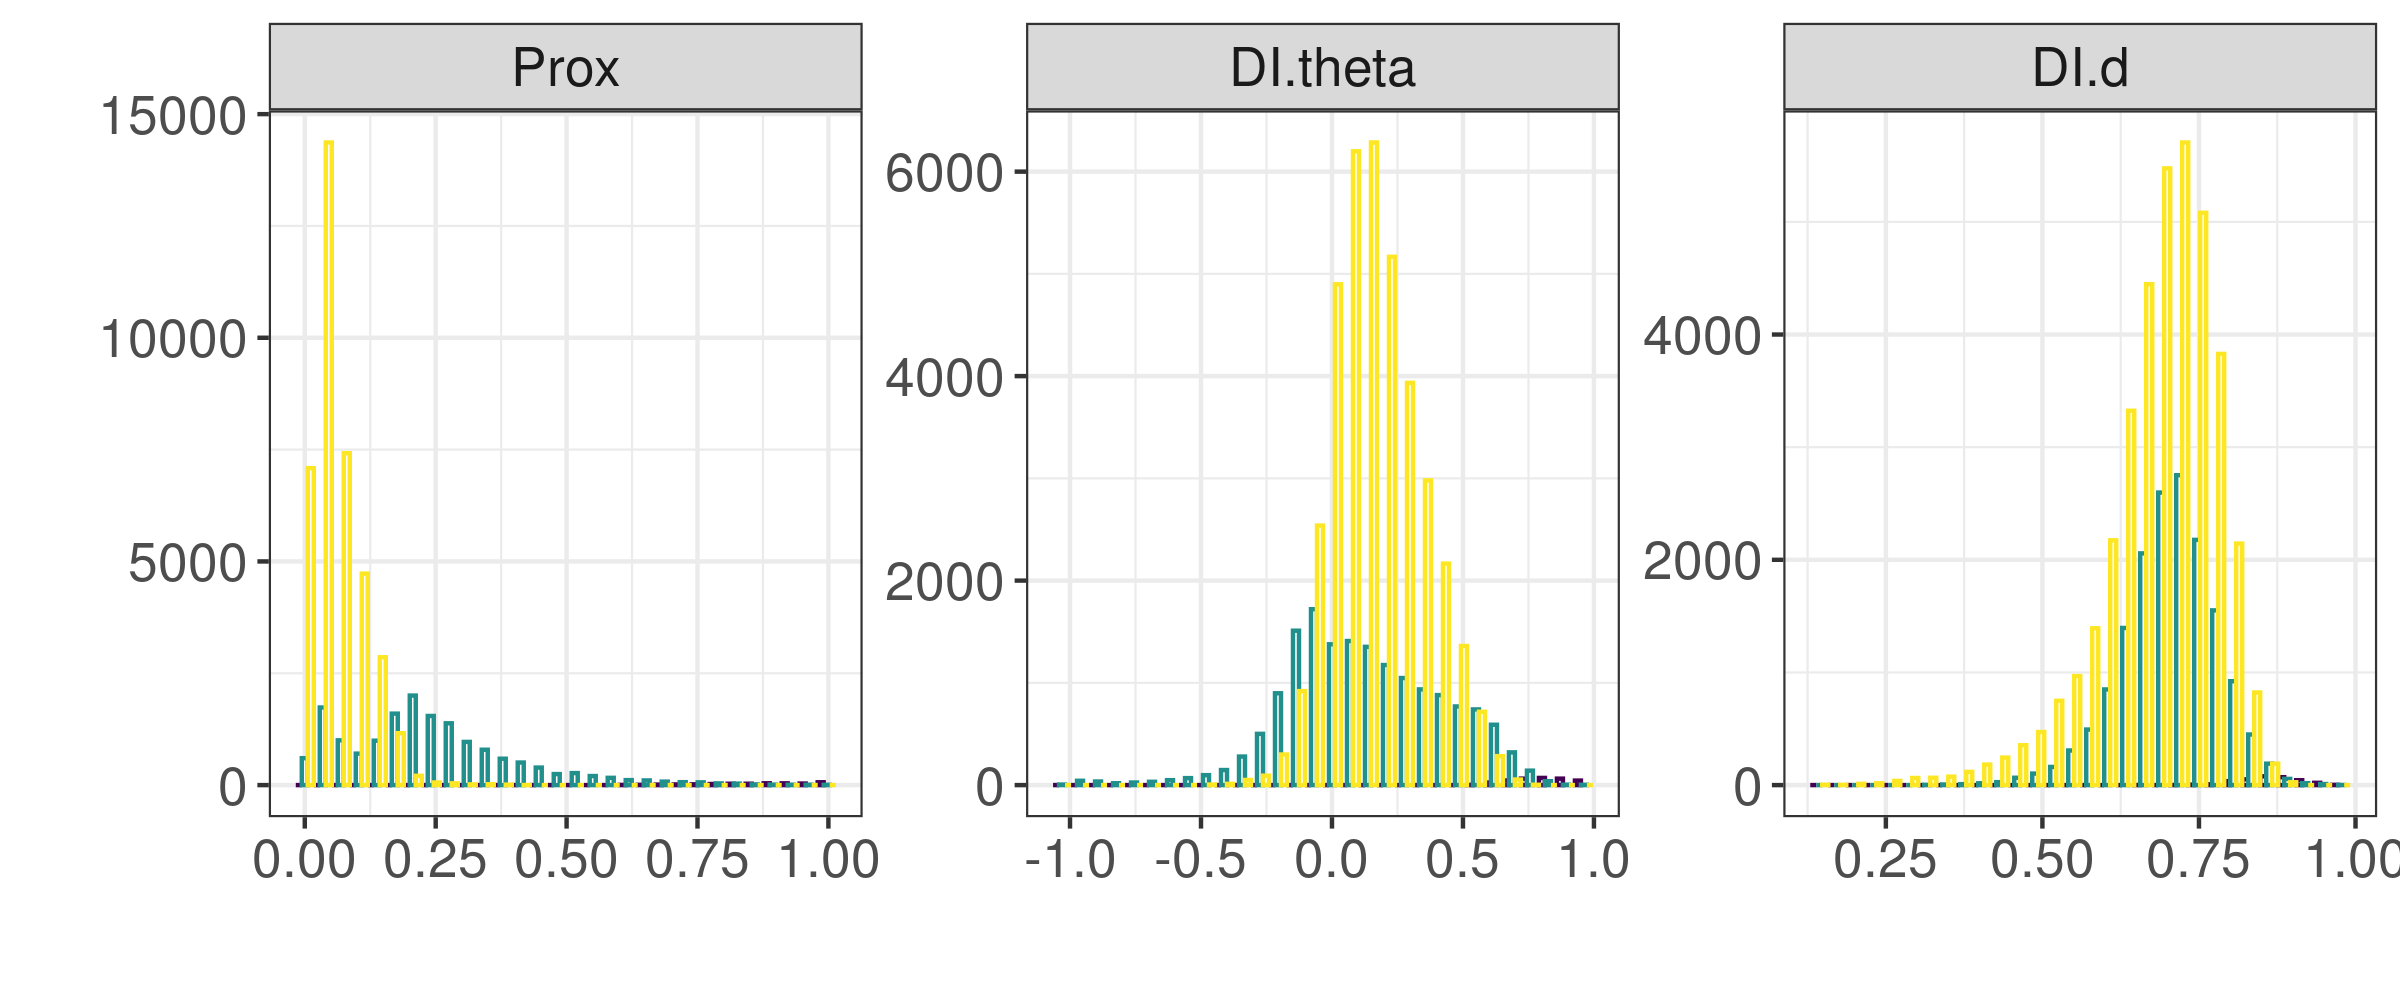
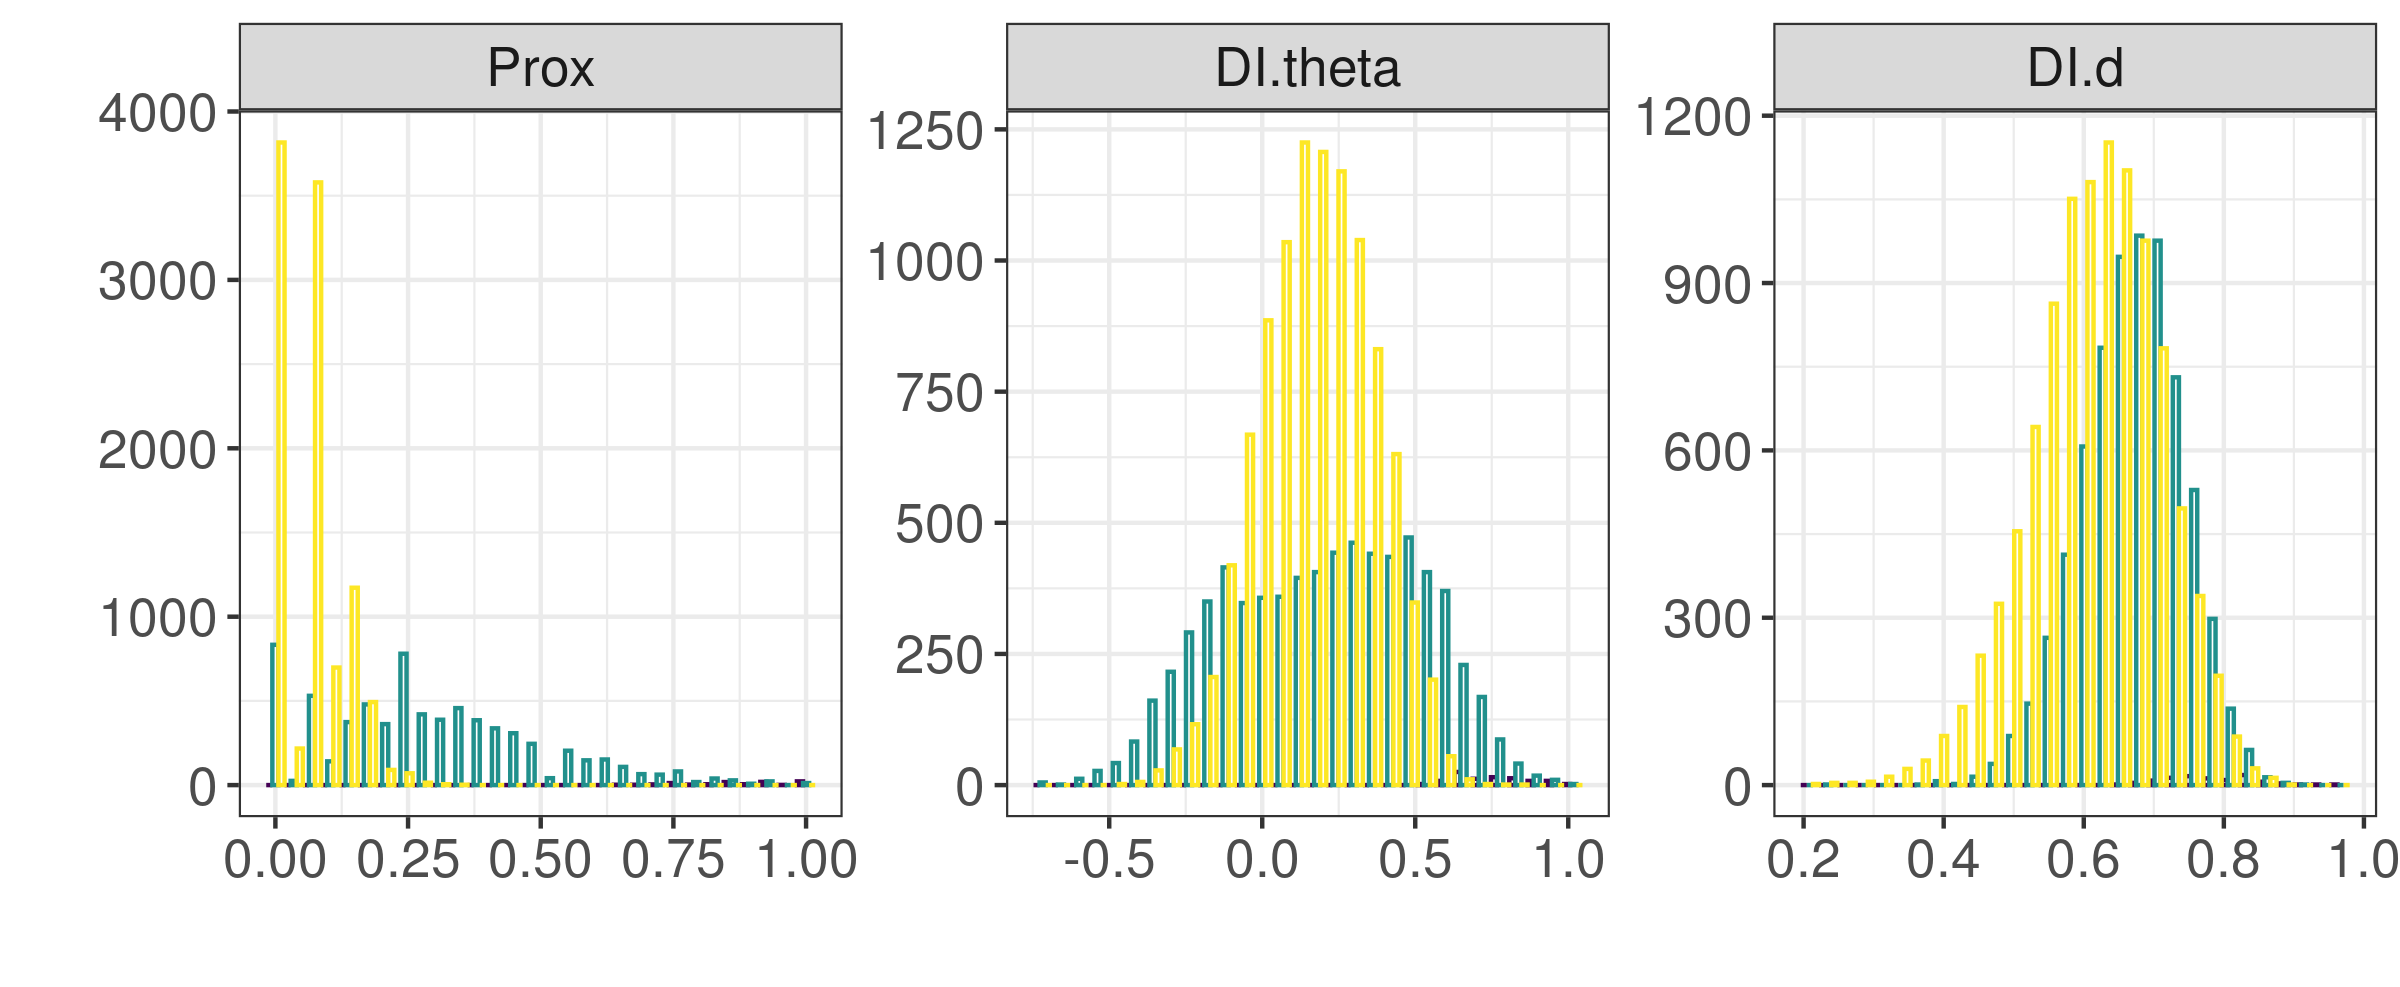
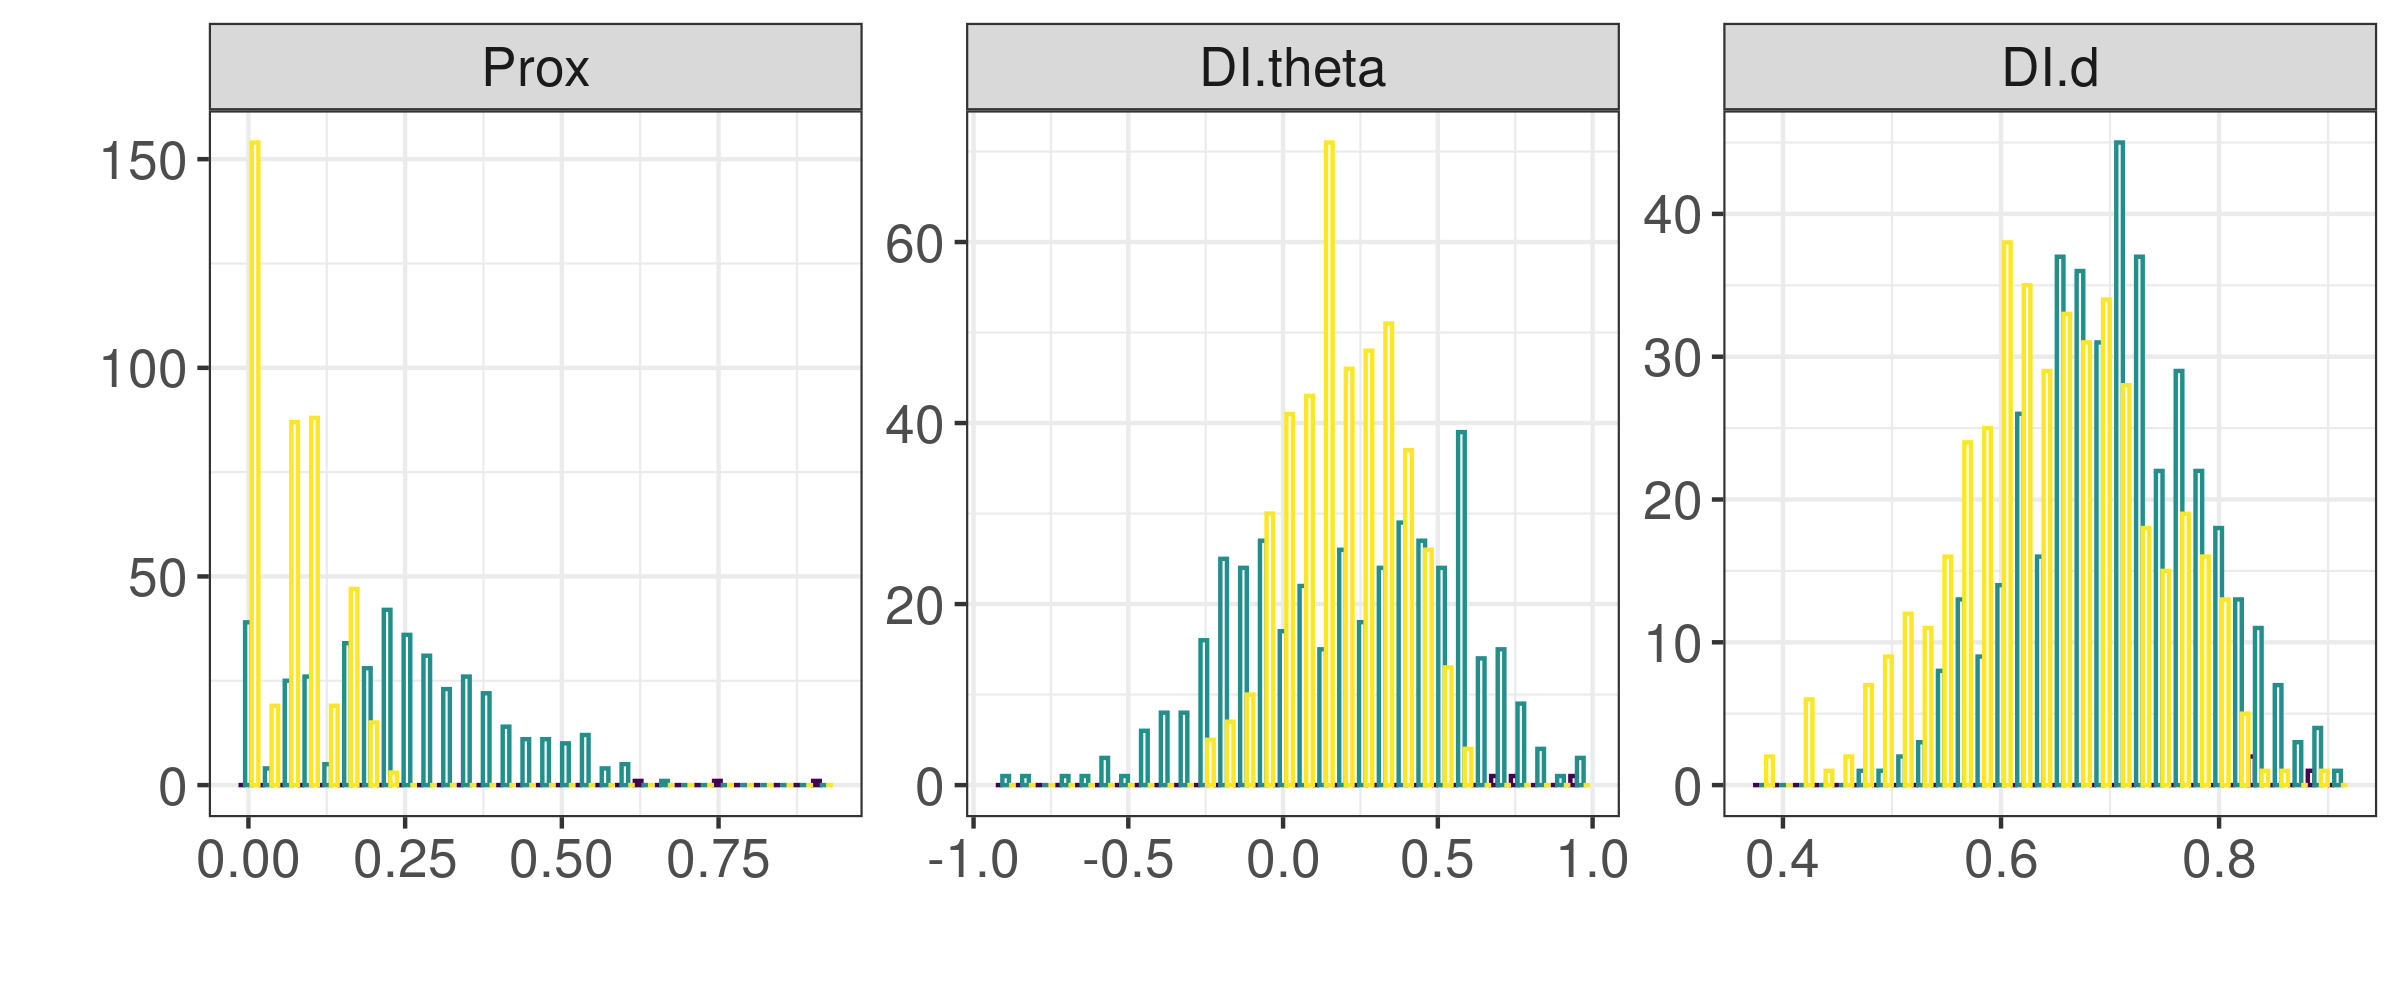
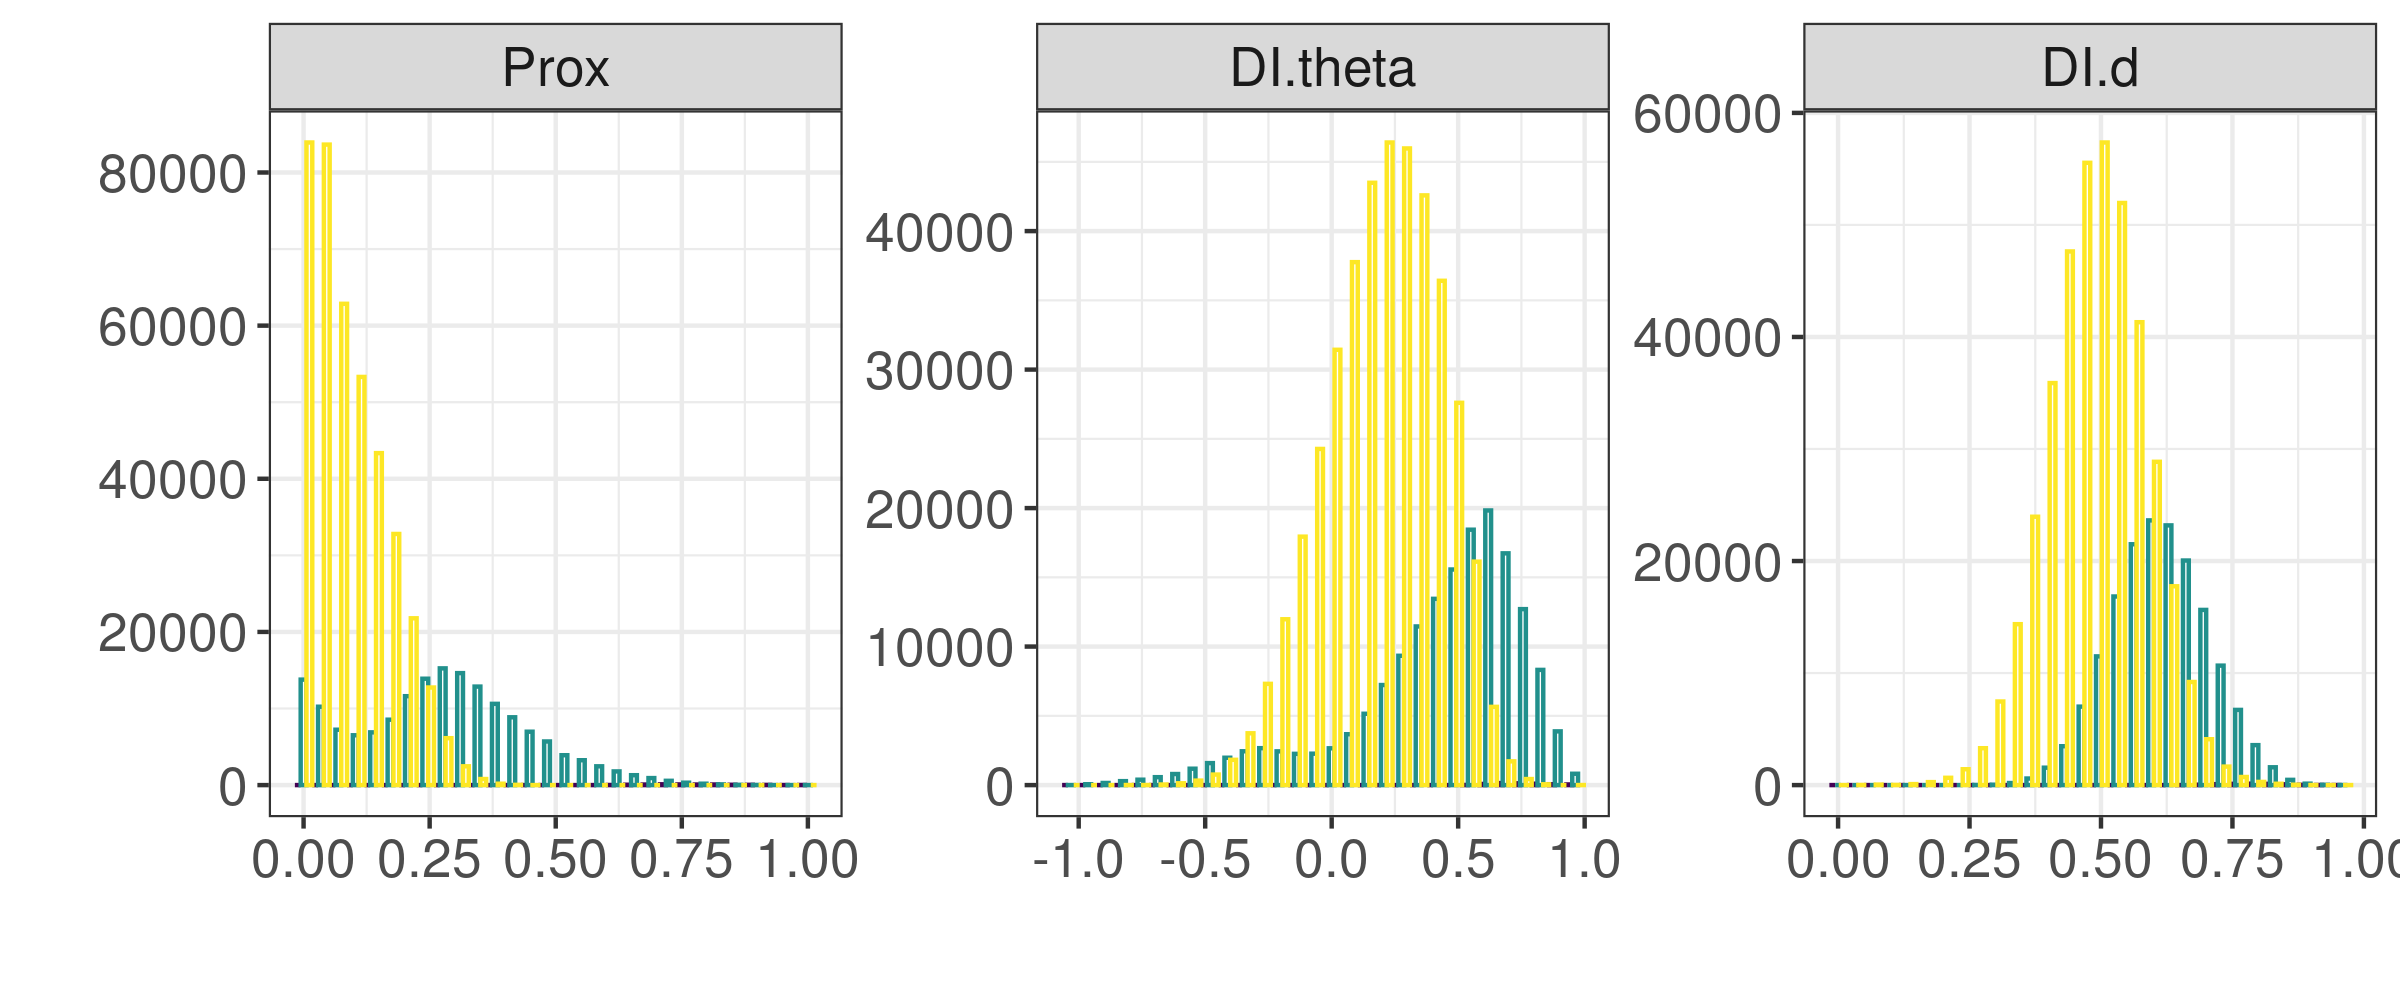
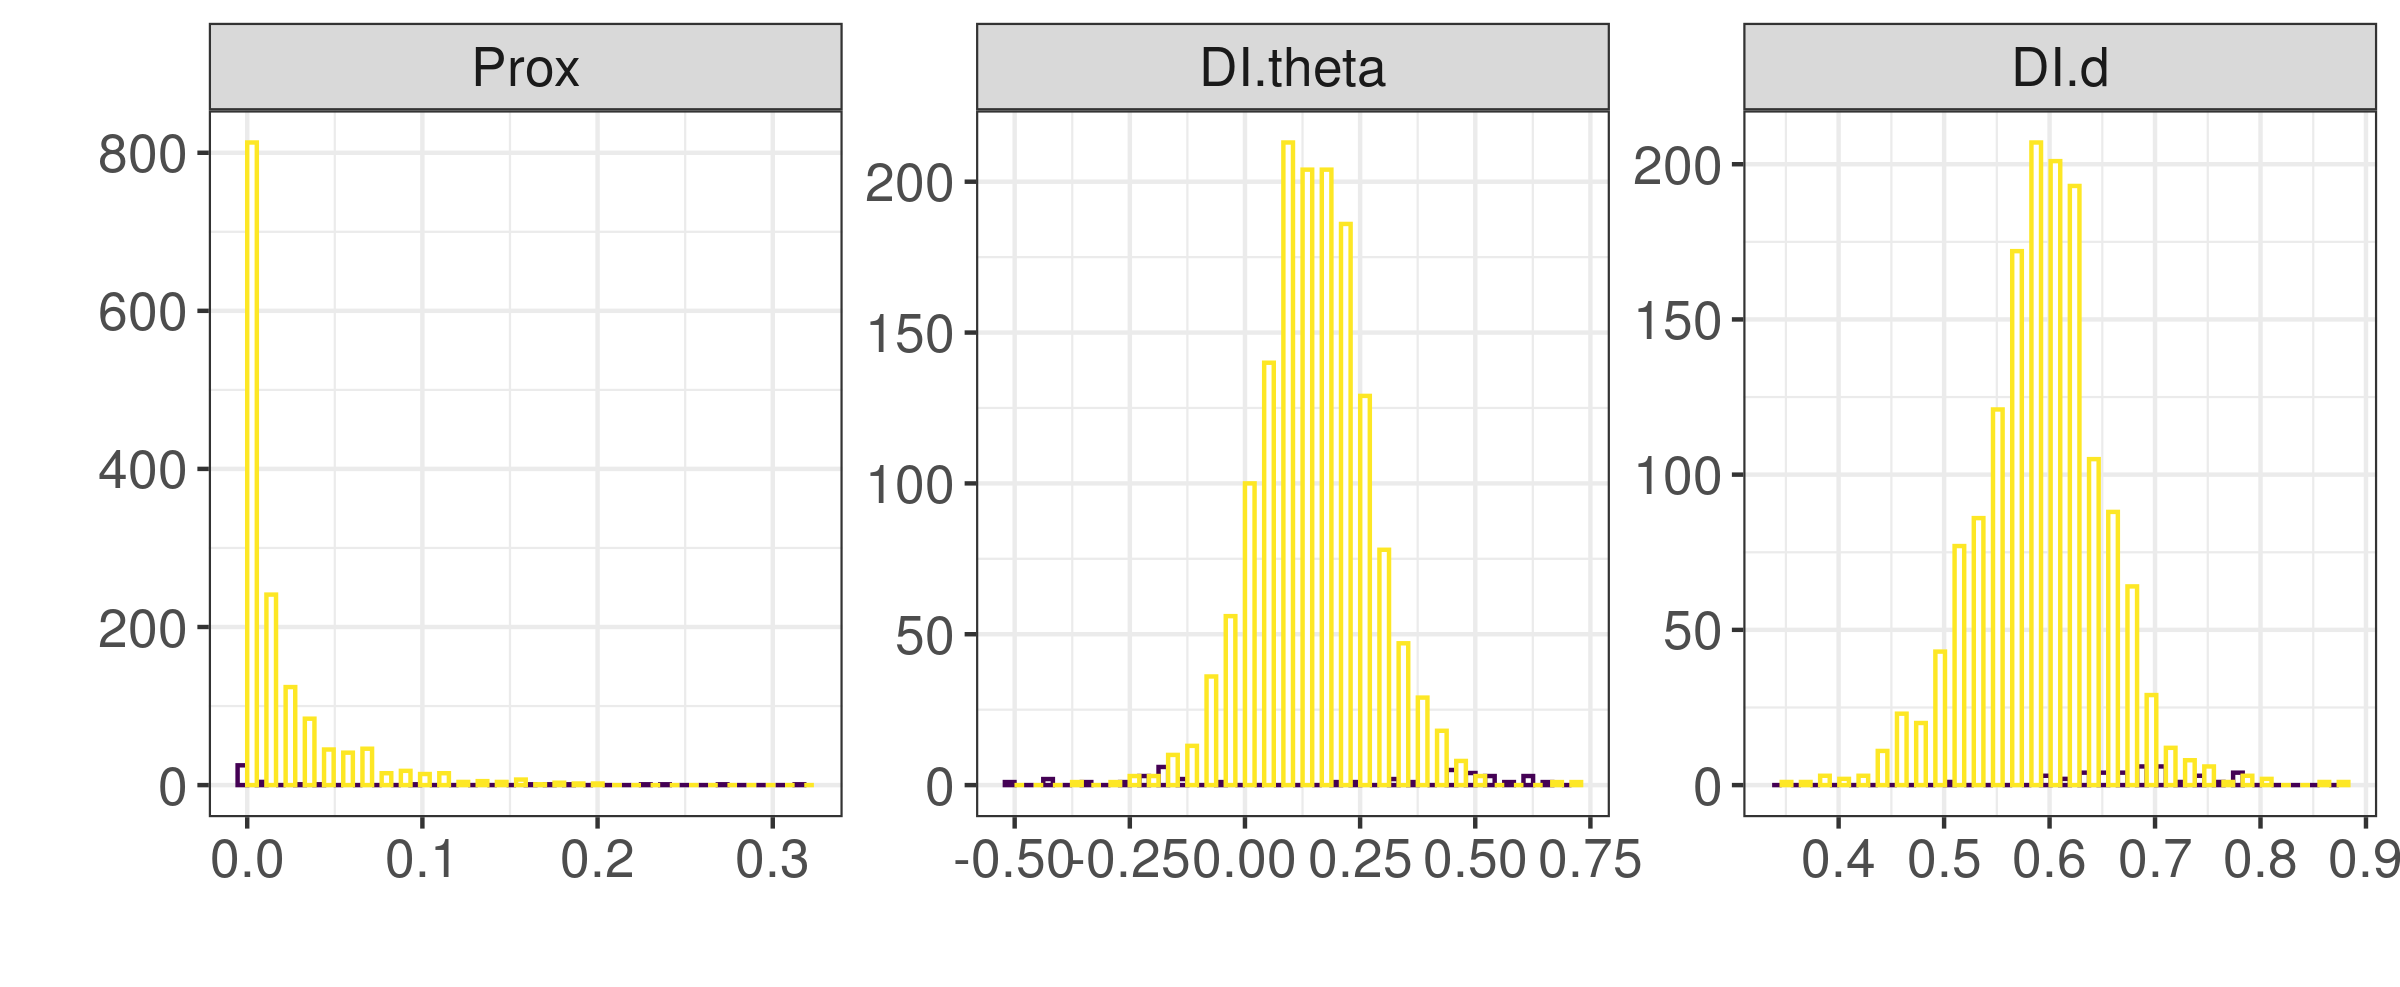
Histograms of the joint movement metrics for the three clusters (in purple, green and yellow) for each fleet. It should be noted that only \(DI_\theta\) ranges from -1 to 1, while Prox and \(DI_d\) take values from 0 to 1.
3.1.1 Pelagic pair trawlers
3.1.2 Large bottom otter trawlers
3.1.3 Small bottom otter trawlers
3.1.4 Mid-water otter trawlers
3.1.5 Anchovy purse-seiners
3.1.6 Tuna purse-seiners
3.2 Animations
For each fleet, the most representative dyad in each group is shown through a spatial representation (the locations have been transformed to respect confidentiality agreements with some of the data providers) and time series of distance (in km), DItheta and DId. The numbers in parenthesis in the distance graphs indicate values of Prox with \(\delta\) equal to 1, 3 or 5.
3.2.1 Pelagic pair trawlers
3.2.1.1 Group 1: most representative example
3.2.1.2 Group 2: most representative example
3.2.1.3 Group 3: most representative example
3.2.2 Large bottom otter trawlers
3.2.2.1 Group 1: most representative example
3.2.2.2 Group 2: most representative example
3.2.2.3 Group 3: most representative example

3.2.3 Small bottom otter trawlers
3.2.3.1 Group 1: most representative example
3.2.3.2 Group 2: most representative example

3.2.3.3 Group 3: most representative example

3.2.4 Mid-water otter trawlers
3.2.4.1 Group 1: most representative example
3.2.4.2 Group 2: most representative example

3.2.4.3 Group 3: most representative example
3.2.5 Anchovy purse-seiners
3.2.5.1 Group 1: most representative example


3.2.5.2 Group 2: most representative example

3.2.5.3 Group 3: most representative example

3.2.6 Tuna purse-seiners
3.2.6.1 Group 2: most representative example
3.2.6.2 Group 3: most representative example